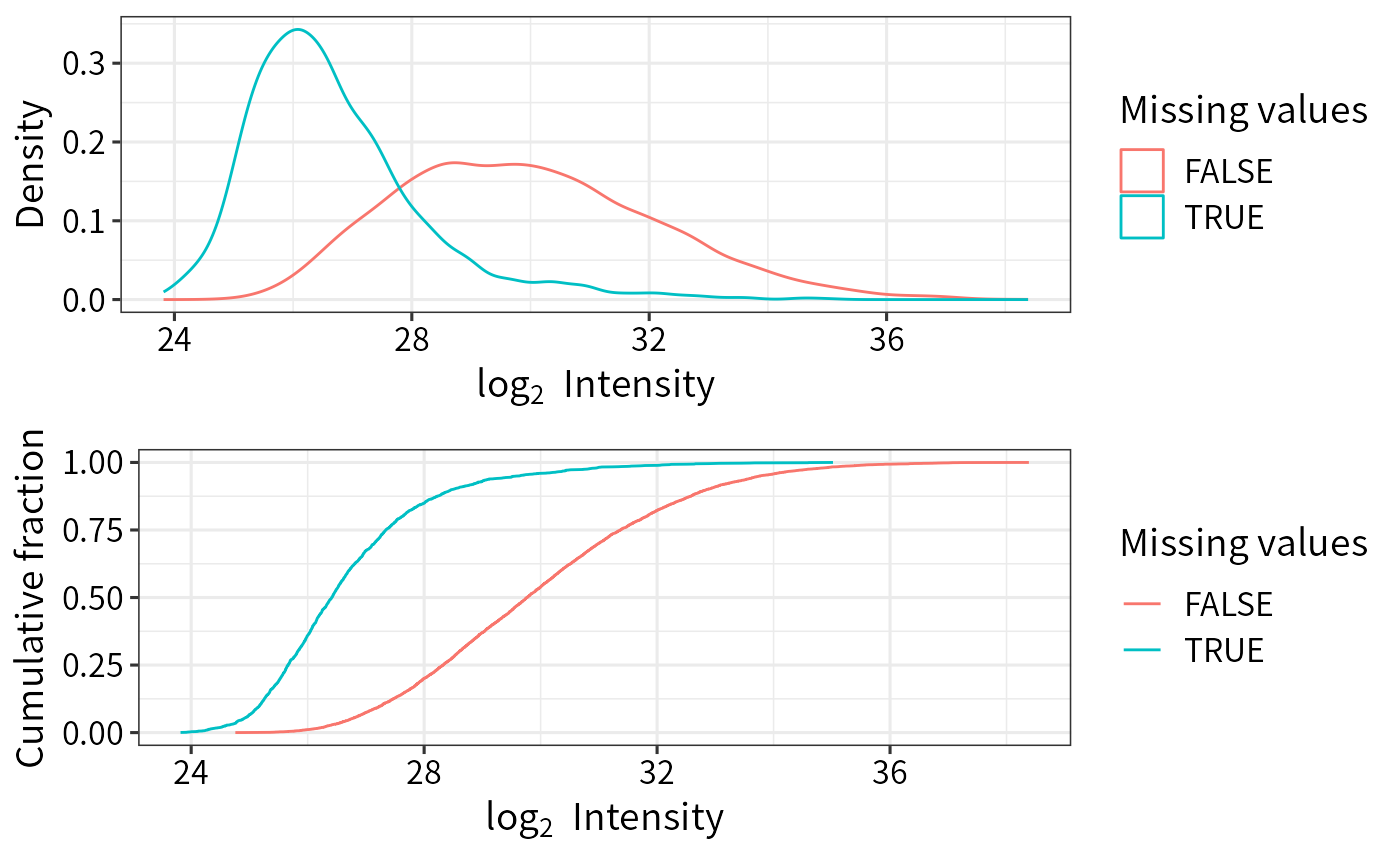
Visualize intensities of proteins with missing values
plot_detect.Rdplot_detect generates density and CumSum plots
of protein intensities with and without missing values
Value
Density and CumSum plots of intensities of
proteins with and without missing values
(generated by ggplot).
Examples
# Load example
data(Silicosis_pg)
data <- Silicosis_pg
data_unique <- make_unique(data, "Gene.names", "Protein.IDs", delim = ";")

# Construct SE
ecols <- grep("LFQ.", colnames(data_unique))
se <- make_se_parse(data_unique, ecols,mode = "delim")

# Filter
filt <- filter_se(se, thr = 0, fraction = 0.4, filter_formula = ~ Reverse != "+" & Potential.contaminant!="+")
#> filter base on missing number is <= 0 in at least one condition.
#> filter base on missing number fraction < 0.4 in each row
#> filter base on giving formula

# Plot intensities of proteins with missing values
plot_detect(filt)
