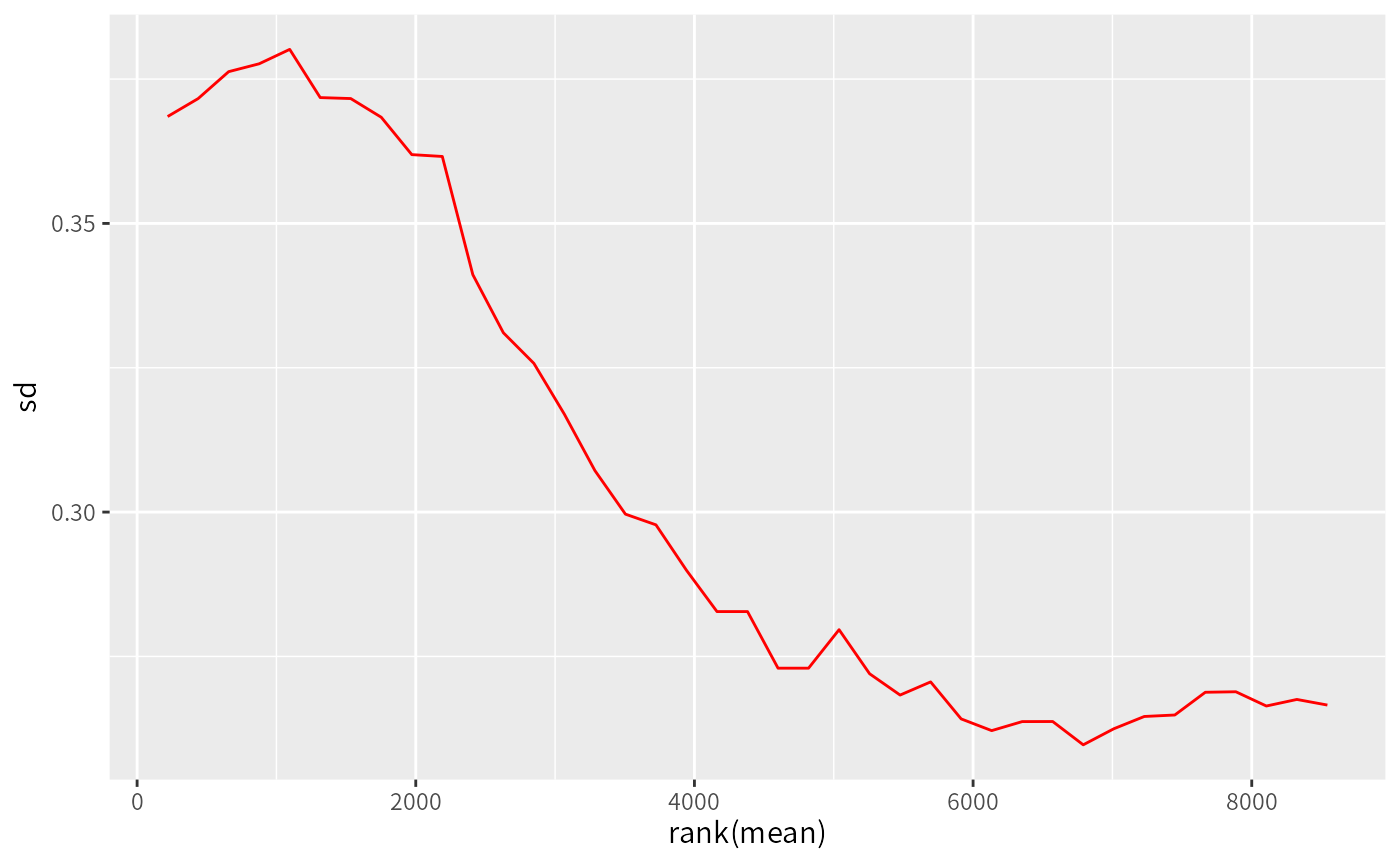
Plot row standard deviations versus row means
meanSdPlot.RdmeanSdPlot generates a hexagonal heatmap
of the row standard deviations versus row means
from SummarizedExperiment objects.
See meanSdPlot.
Usage
meanSdPlot(
  x,
  ranks = TRUE,
  xlab = ifelse(ranks, "rank(mean)", "mean"),
  ylab = "sd",
  pch,
  plot = TRUE,
  bins = 50,
  ...
)
Arguments
- x
SummarizedExperiment, Data object.
- ranks
Logical, Whether or not to plot the row means on the rank scale.
- xlab
Character, x-axis label.
- ylab
Character, y-axis label.
- pch
Ignored - exists for backward compatibility.
- plot
Logical, Whether or not to produce the plot.
- bins
Numeric vector, Data object before normalization.
- ...
Other arguments, Passed to
stat_binhex.
Value
A scatter plot of row standard deviations
versus row means(generated by stat_binhex)
Examples
# Load example
data(Silicosis_pg)
data <- Silicosis_pg
data_unique <- make_unique(data, "Gene.names", "Protein.IDs", delim = ";")

# Differential test
ecols <- grep("LFQ.", colnames(data_unique))
se <- make_se_parse(data_unique, ecols,mode = "delim")
filt <- filter_se(se, thr = 0, fraction = 0.4, filter_formula = ~ Reverse != "+" & Potential.contaminant!="+")
#> filter base on missing number is <= 0 in at least one condition.
#> filter base on missing number fraction < 0.4 in each row
#> filter base on giving formula
norm <- normalize_vsn(filt)
#> vsn2: 8762 x 20 matrix (1 stratum).
#> Please use 'meanSdPlot' to verify the fit.

# Plot meanSdPlot
meanSdPlot(norm)
#> Warning: Computation failed in `stat_binhex()`
#> Caused by error in `compute_group()`:
#> ! The package "hexbin" is required for `stat_binhex()`
