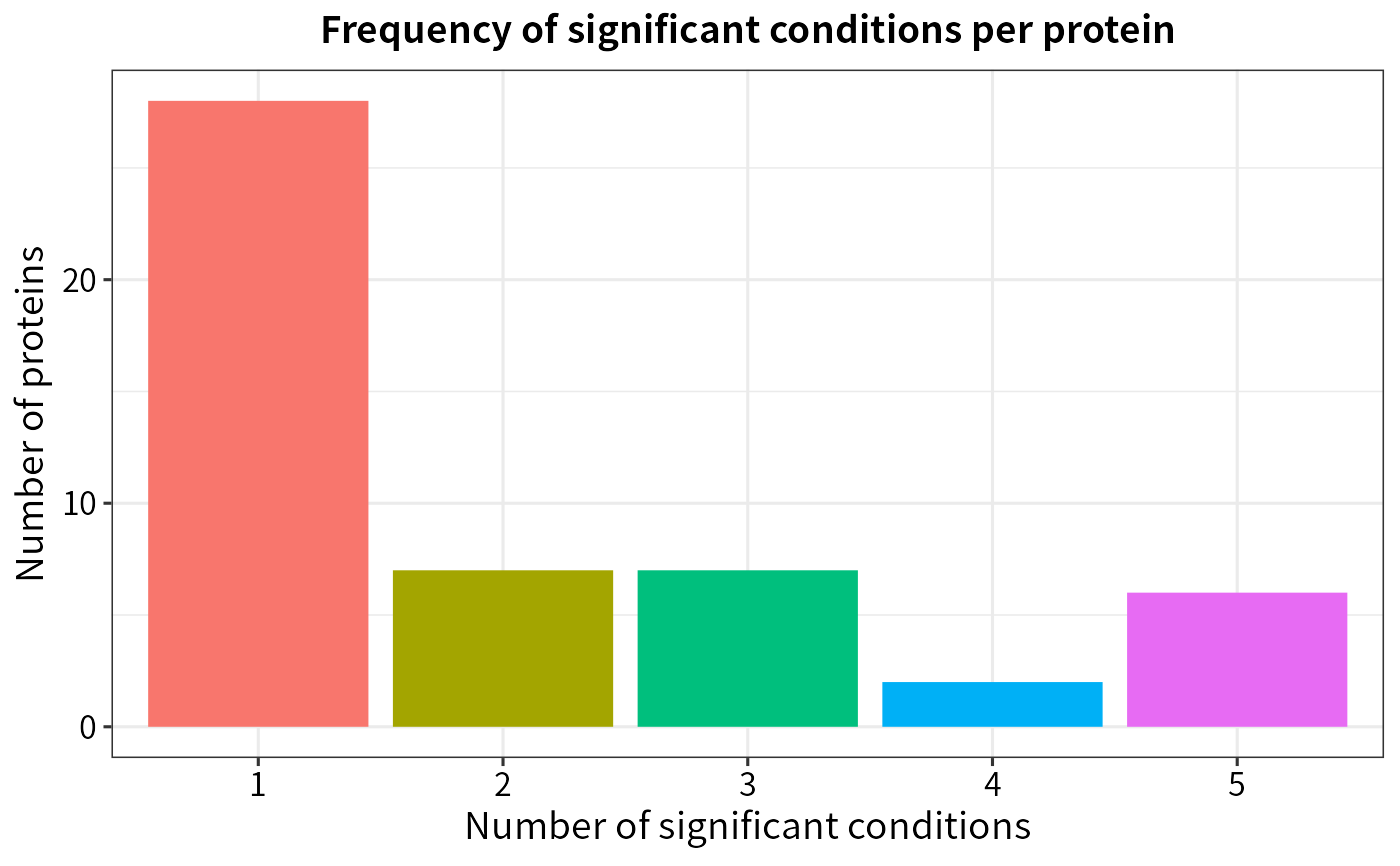
Plot frequency of significant conditions per protein
plot_cond_freq.Rdplot_cond_freq generates a histogram of the number of significant conditions per protein.
Arguments
- dep
SummarizedExperiment, Data object for which differentially enriched proteins are annotated (output from
test_diff()andadd_rejections()).- plot
Logical(1), If
TRUE(default) the histogram is produced. Otherwise (ifFALSE), the data which the histogram is based on are returned.
Value
A histogram (generated by ggplot)
Examples
# Load example
data(Silicosis_pg)
data <- Silicosis_pg
data_unique <- make_unique(data, "Gene.names", "Protein.IDs", delim = ";")

# Make SummarizedExperiment
ecols <- grep("LFQ.", colnames(data_unique))
se <- make_se_parse(data_unique, ecols, mode = "delim", sep = "_")

# Analysis
filt <- filter_se(se, thr = 0, fraction = 0.3, filter_formula = ~ Reverse != "+" & Potential.contaminant!="+")
#> filter base on missing number is <= 0 in at least one condition.
#> filter base on missing number fraction < 0.3 in each row
#> filter base on giving formula
norm <- normalize_vsn(filt)
#> vsn2: 8832 x 20 matrix (1 stratum).
#> Please use 'meanSdPlot' to verify the fit.
imputed <- impute(norm, fun = "MinDet")
#> Imputing along margin 2 (samples/columns).
diff <- test_diff(imputed,type = "control", control = "PBS")
#> Tested contrasts: W10_vs_PBS, W2_vs_PBS, W4_vs_PBS, W6_vs_PBS, W9_vs_PBS
#> Strimmer's qvalue(t)
dep <- add_rejections(diff)

# Plot frequency of significant conditions
plot_cond_freq(dep)
