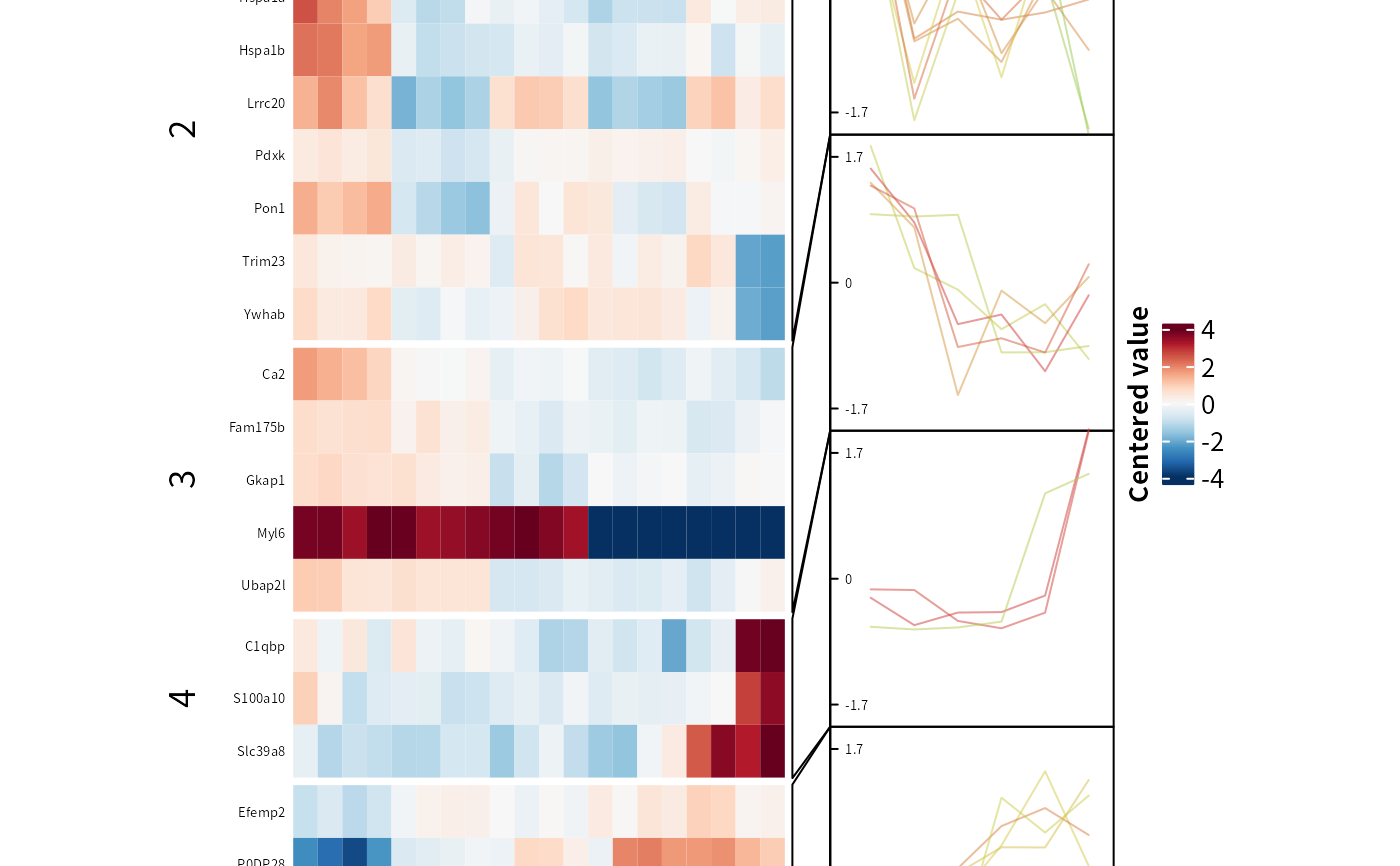
Time-course clustering
get_tc_cluster.RdExpression pattern clustering for timecourse or multi-group experiment via
timeclust()
Usage
get_tc_cluster(
  x,
  ht_mat,
  exp_design,
  groupby = "condition",
  group_order = NULL,
  k = 6,
  dist = "euclidean",
  color = c("RdBu", "RdYlBu", "RdYlGn", "BrBG", "PiYG", "PRGn", "PuOr", "RdGy",
    "Spectral"),
  col_limit = 4,
  row_font_size = 5,
  col_font_size = 5,
  heatmap_width = 3,
  heatmap_height = 5,
  seed = NULL
)
Arguments
- x
a SummarizedExperiment or DEGdata object.
- ht_mat
Data.frame or matrix, the expresiong assay. If x is provided, be reset to assay(x).
- exp_design
Data.frame, the experiment design. If x is provided, be reset to colData(x)
- groupby
Character(1), group by which column in experiment design.
- group_order
Character vector or factor, the order of groups in the
groupbycolumn.- k
Integer(1), the number of clusters.
- color
Character(1), sets the color panel (from RColorBrewer). It can be a palette name in "RdBu", "RdYlBu", "RdYlGn", "BrBG", "PiYG", "PRGn", "PuOr", "RdGy", "Spectral".
- col_limit
Numeric(1), sets the outer limits of the color scale.
- row_font_size
Integer(1), font size of row name
- col_font_size
Integer(1), font size of columns label.
- heatmap_width
Numeric(1)
- heatmap_height
Numeric(1)
- seed
Integer(1) or NULL, the random seed.
Value
A list contains:
a cluster heatmap(Heatmap object from ComplexHeatmap),
the cluster result for heatmap(data.frame),
the output of
timeclustand the seed.
Examples
# Load sample
data(Silicosis_pg)
data <- Silicosis_pg
data_unique <- make_unique(data, "Gene.names", "Protein.IDs", delim = ";")

# Make SummarizedExperiment
ecols <- grep("LFQ.", colnames(data_unique))
se <- make_se_parse(data_unique, ecols, mode = "delim", sep = "_")

filt <- filter_se(se, thr = 0, fraction = 0.3, filter_formula = ~ Reverse != "+" & Potential.contaminant!="+")
#> filter base on missing number is <= 0 in at least one condition.
#> filter base on missing number fraction < 0.3 in each row
#> filter base on giving formula
norm <- normalize_vsn(filt)
#> vsn2: 8832 x 20 matrix (1 stratum).
#> Please use 'meanSdPlot' to verify the fit.
imputed <- impute(norm, fun = "MinProb", q = 0.05)
#> Imputing along margin 2 (samples/columns).
#> [1] 0.3026538
diff <- test_diff(imputed,type = "control", control = "PBS")
#> Tested contrasts: W10_vs_PBS, W2_vs_PBS, W4_vs_PBS, W6_vs_PBS, W9_vs_PBS
#> Strimmer's qvalue(t)
dep <- add_rejections(diff)

# Expression pattern cluster
TC <- get_tc_cluster(get_signicant(dep),
                     group_order = c("PBS","W2","W4","W6","W9","W10"), # set the group order
                     heatmap_width = 2.5, heatmap_height = 5
)
#> aabb[1] "start timeclust"
#> beging 'cm' cluster by dist = 'euclidean'
#> [1] "finish heatmap"
TC$ht # Heatmap

head(TC$res)
#>          name Timecourse_cluster         mebership              PBS_1
#> C1qbp   C1qbp                  4 0.886304715790769  0.420263091052544
#> Ca2       Ca2                  3 0.411242340092725   1.69065263119242
#> Cldn18 Cldn18                  2 0.686617687623295   1.23958646631143
#> Dhx58   Dhx58                  1 0.846778402740017  -2.06544095513807
#> Dnmt3a Dnmt3a                  6 0.552528926838831 -0.904896251325489
#> Efemp2 Efemp2                  5 0.505110922852042 -0.930272399356138
#>                     PBS_2             PBS_3              PBS_4
#> C1qbp  -0.195529409711714 0.424599288402426 -0.575735101668087
#> Ca2      1.41759313041917  1.21867872572312  0.871398543111233
#> Cldn18   1.14834276230686  1.17683392038859  0.649627636229976
#> Dhx58   -1.96084347617414 -2.93920556318203   -3.1943284449183
#> Dnmt3a -0.939565872453979 -1.17776444420126 -0.906231190648125
#> Efemp2 -0.605958902335448 -1.08561736048544 -0.812065013310434
#>                      W2_1               W2_3                W2_4
#> C1qbp   0.515549989532623 -0.204071405680601   -0.36550912598274
#> Ca2     0.098613225762044 0.0159171430763649 -0.0158498148229711
#> Cldn18 -0.360596970057859  -0.47187623920922    -0.4255120562602
#> Dhx58   0.746457200193323   1.24456979871951   0.821772070624508
#> Dnmt3a  0.783357254120432   1.08808001389562   0.868693353844201
#> Efemp2  -0.15358956170402  0.174213060034393   0.249851981034421
#>                      W2_5                W4_2               W4_3
#> C1qbp   0.062132795471836  -0.162074321207182 -0.485304611494996
#> Ca2     0.100742763687713   -0.37424848888098 -0.119820470177196
#> Cldn18 -0.288477991839169   0.330153178862002  0.239899871574369
#> Dhx58    1.03333640641943    1.13127573675511  0.192532251407595
#> Dnmt3a  0.749978466197163   0.583297318826038 -0.395325255498001
#> Efemp2  0.214905350869383 0.00808615857910056 -0.244696885643624
#>                      W4_4                W4_5                W6_2
#> C1qbp   -1.24162814651021   -1.16854438888593  -0.443699676074125
#> Ca2    -0.181299577487948 -0.0116517269610839  -0.460001709658762
#> Cldn18  0.199424707360595   0.567415080217049  -0.619790712033538
#> Dhx58   0.716047237780469 0.00185594051893645   0.123212926214716
#> Dnmt3a  0.277692440227106  -0.312137949657195 -0.0517147839181824
#> Efemp2 0.0411470168599486  -0.173965660789197   0.363980847906301
#>                      W6_3               W6_4               W6_6
#> C1qbp  -0.792023214384841 -0.480044206757867  -2.07162607062625
#> Ca2    -0.530563532665759 -0.776238614295806 -0.539418285530573
#> Cldn18 -0.783321687943666 -0.794706626067534 -0.405821220765933
#> Dhx58   0.734945929150886  0.642967460601366  0.555262089321882
#> Dnmt3a  0.477148540207022  0.228572037733063  0.393591813383914
#> Efemp2 0.0413562665920004   0.50074823953592  0.342584869825163
#>                      W9_2                W9_4               W10_2
#> C1qbp   -0.77498614221431  -0.342256735421753     3.8874092603213
#> Ca2    -0.163821633610759  -0.476498689126373  -0.713390780262202
#> Cldn18 -0.129757499196334 -0.0287980472910228  -0.414560565381205
#> Dhx58   0.393764307310281   0.481596331711717   0.840155068871187
#> Dnmt3a -0.439023661513279   -0.22878860702064 -0.0366646751473709
#> Efemp2  0.925971985604367   0.835542242088724   0.115609350582677
#>                      W10_4
#> C1qbp     3.99307813183992
#> Ca2      -1.05079283949163
#> Cldn18  -0.828064007205182
#> Dhx58    0.500067683811611
#> Dnmt3a -0.0582985470510273
#> Efemp2   0.192168414111929